
Skeda:RiemannCriticalLine.svg

Size of this PNG preview of this SVG file: 800 × 372 pixel. Rezolucione të tjera: 320 × 149 pixel | 640 × 298 pixel | 1.024 × 476 pixel | 1.280 × 595 pixel | 2.560 × 1.191 pixel | 933 × 434 pixel.
Dokument origjinal (skedë SVG, fillimisht 933 × 434 pixel, madhësia e skedës: 50 KB)
| Kjo skedë është prej Wikimedia Commons dhe mund të përdoret nga projekte të tjera. Përshkrimi në këtë skedë në këtë faqe nuk është treguar më poshtë. | Shko tek faqja përshkruese në Commons |
W3C-validity not checked.
Përmbledhje
| Përshkrimi |
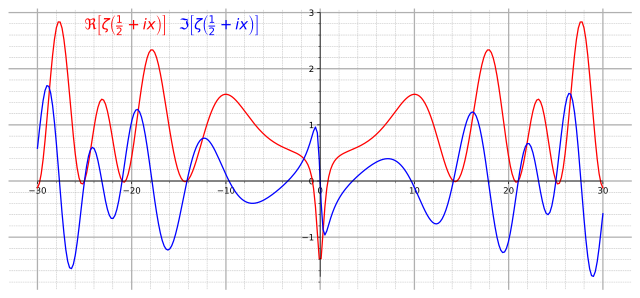
English: Graph of real (red) and imaginary (blue) parts of the critical line Re(z)=1/2 of the Riemann zeta function. |
||
| Data | |||
| Burimi |
Own work. Made with Mathematica using the following code: Show[Plot[{Re[Zeta[1/2+I x]], Im[Zeta[1/2+I x]]}, {x,-30, 30},AxesLabel->{"x"} , PlotStyle->{Red, Blue}, Ticks->{Table[4x-28,{x,0,14}]}, ImageSize->{800,600}],
Graphics[Text[Style[\[DoubleStruckCapitalR][\[Zeta][ I x + "1/2"]],14,Red ,Background ->White],{-22,2.6} ]],
Graphics[Text[Style[\[GothicCapitalI][\[Zeta][ I x + "1/2"]],14,Blue ,Background ->White],{-14,2.6} ]]] |
||
| Autori | Slonzor | ||
| Leja (Ripërdor këtë skedë) |
Public Domain | ||
| SVG genesis | This plot was created with Matplotlib by Krishnavedala. | ||
| Kodi burimor | Python code
|
Licencim
| Unë,krijuesi i kësaj pune, e lëshoj këtë punë në public domain. Kjo aplikohet në të gjithë botën. Në disa vende kjo mund të mos jetë e mundur ligjërisht; nëse është kështu: Unë i garantoj çdokujt të drejtën për ta përdorur këtë punë për çdo qëllim, pa asnjë kusht, përveç rasteve kur këto kushte janë të kërkuara nga ligji. |
Historiku skedës
Shtypni mbi një datë/kohë për ta parë skedën siç ishte atëherë.
| Data/Koha | Miniaturë | Përmasat | Përdoruesi | Koment | |
|---|---|---|---|---|---|
| e tanishme | 23 gusht 2017 22:01 | | 933 × 434 (50 KB) | Krishnavedala | much reduced vector version |
| 25 shtator 2009 00:28 |  | 800 × 600 (122 KB) | Geek3 | linewidth=1px | |
| 20 nëntor 2008 21:33 |  | 800 × 600 (122 KB) | Slonzor | Man i've messed this up a lot of times. | |
| 20 nëntor 2008 21:27 |  | 800 × 600 (3,36 MB) | Slonzor | ||
| 20 nëntor 2008 21:23 |  | 800 × 600 (3,36 MB) | Slonzor | ||
| 20 nëntor 2008 21:18 |  | 800 × 600 (3,36 MB) | Slonzor | ||
| 20 nëntor 2008 21:13 |  | 800 × 600 (79 KB) | Slonzor | {{Information |Description={{en|1=Graph of real (red) and imaginary (blue) parts of the critical line Re(z)=1/2 of the Riemann zeta function.}} |Source=Own work. Made with Mathematica using the following code: <code><nowiki>Show[Plot[{Re[Zeta[1/2+I x]], |
Lidhje skedash
Këto faqe lidhen tek kjo skedë:
Përdorimi global i skedës
Kjo skedë përdoret nga Wiki të tjera në vijim:
- Përdorimi në ar.wikipedia.org
- Përdorimi në ba.wikipedia.org
- Përdorimi në be.wikipedia.org
- Përdorimi në ca.wikipedia.org
- Përdorimi në ckb.wikipedia.org
- Përdorimi në da.wikipedia.org
- Përdorimi në el.wikipedia.org
- Përdorimi në en.wikipedia.org
- Përdorimi në eo.wikipedia.org
- Përdorimi në eu.wikipedia.org
- Përdorimi në fa.wikipedia.org
- Përdorimi në fi.wikipedia.org
- Përdorimi në he.wikipedia.org
- Përdorimi në hi.wikipedia.org
- Përdorimi në hy.wikipedia.org
- Përdorimi në id.wikipedia.org
- Përdorimi në it.wikipedia.org
- Përdorimi në it.wikiquote.org
- Përdorimi në ja.wikipedia.org
- Përdorimi në ko.wikipedia.org
- Përdorimi në la.wikipedia.org
- Përdorimi në mn.wikipedia.org
- Përdorimi në nn.wikipedia.org
- Përdorimi në no.wikipedia.org
- Përdorimi në pa.wikipedia.org
- Përdorimi në pt.wikipedia.org
- Përdorimi në ru.wikipedia.org
- Përdorimi në sl.wikipedia.org
- Përdorimi në sr.wikipedia.org
- Përdorimi në uk.wikipedia.org
- Përdorimi në vi.wikipedia.org
- Përdorimi në zh-yue.wikipedia.org
- Përdorimi në zh.wikipedia.org
Shikoni më shumë përdorim global të kësaj skede.