
Skeda:Greenhouse Gas by Sector.png

Madhësia e këtij shikimi: 600 × 600 pixel. Rezolucione të tjera: 240 × 240 pixel | 480 × 480 pixel | 768 × 768 pixel | 1.024 × 1.024 pixel | 1.632 × 1.632 pixel.
Dokument origjinal ((përmasa 1.632 × 1.632 px, madhësia skedës: 366 KB, lloji MIME: image/png))
| Kjo skedë është prej Wikimedia Commons dhe mund të përdoret nga projekte të tjera. Përshkrimi në këtë skedë në këtë faqe nuk është treguar më poshtë. | Shko tek faqja përshkruese në Commons |

|
File:Greenhouse gas by sector 2000.svg is a vector version of this file. It should be used in place of this PNG file when not inferior.
File:Greenhouse Gas by Sector.png → File:Greenhouse gas by sector 2000.svg
For more information, see Help:SVG. |
 |
Përmbledhje
| Përshkrimi |
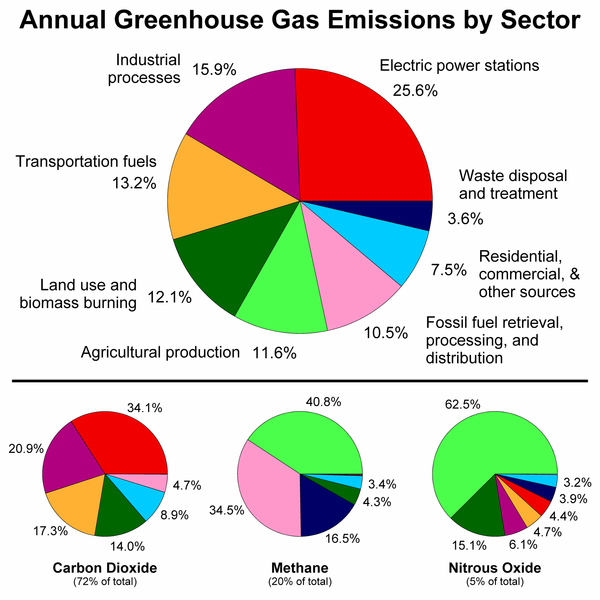
English: This figure shows the relative fraction of man-made greenhouse gases coming from each of eight categories of sources, as estimated by the Emission Database for Global Atmospheric Research version 4.2, fast track 2010 project [1]. These values are intended to provide a snapshot of global annual greenhouse gas emissions in the year 2000.
The top panel shows the sum over all anthropogenic greenhouse gases, weighted by their global warming potential over the next 100 years. This consists of 72% carbon dioxide, 20% methane, 5% nitrous oxide and 3% all other gases. Lower panels show the comparable information for each of these three primary greenhouse gases, with the same coloring of sectors as used in the top chart. Segments with less than 1% fraction are not labeled.
עברית: תמונה זו מראה את החלוקה היחסית של פליטות גזי חממה מעשה ידי אדם, על פי 8 קטגוריות של מקורות, כפי שהדבר מוערך על ידי w:Emission Database for Global Atmospheric Research version 4.2, fast track 2010 project [2].
ערכים אלו אמורים לספק תמונת מצב של שנת 2000. הפנל העליון מראה את סך הפליטות של גזי חממה כשהם נשקלים על פי פוטנציאל אפקט החממה שלהם במשך 100 השנים הבאות. זה מורכב מ 72% של he:פחמן דו חמצני, 20% he:מתאן, 5% he:תחמוצת החנקן, ו3% גזים אחרים. הפנלים התחתונים מראים את ההשוואה היחסית של כל אחד מהגזים האלה, עם אותים צבעים לסקטורים שונים כמו בפנל העליון. סמגנטים עם תרומה נמוכה מ 1% אינם מסומנים. |
| Burimi | Punë e juaja |
| Autori | Robert A. Rohde |
| Versione tjera |
Derivative works of this file: |

Licencim
This figure was prepared by Robert A. Rohde from publicly available data and is part of the Global Warming Art project.
Image from Global Warming Art
This image is an original work created for Global Warming Art. Please refer to the image description page for more information.

|
Ju jepet leje për ta kopjuar, shpërndarë dhe/ose ndryshuar këtë dokument sipas kushteve të Licencës GNU për Dokumentim të Lirë, versioni 1.2 ose çfarëdo versioni të mëpasshëm të botuar nga Free Software Foundation; pa Seksione të Pandryshueshme, pa Tekste Kapakësh të Përparmë, dhe pa Tekste Kapakësh të Pasmë. Një kopje e kësaj licence është përfshirë në seksionin e titulluar GNU Free Documentation License. |
| Kjo skedë licencohet sipas Creative Commons Attribution-Share Alike 3.0 Unported. | ||
| ||
| Kjo etiketë licencimi u shtua te kjo skedë si pjesë e përditësimit të lincecimit. GFDL. |
Historiku skedës
Shtypni mbi një datë/kohë për ta parë skedën siç ishte atëherë.
| Data/Koha | Miniaturë | Përmasat | Përdoruesi | Koment | |
|---|---|---|---|---|---|
| e tanishme | 14 mars 2019 09:42 | | 1.632 × 1.632 (366 KB) | Dragons flight | Some suggested tweaks in category labels |
| 13 mars 2019 14:04 |  | 1.632 × 1.632 (366 KB) | Dragons flight | Updates diagram to use the EDGAR 4.2 FT2010 values for the year 2010 | |
| 23 nëntor 2006 19:36 |  | 650 × 603 (33 KB) | Xiaowei | == Description == This figure shows the relative fraction of man-made greenhouse gases coming from each of eight categories of sources, as estimated by the Emission Database for Global Atmospheric Research version 3.2, fast track 2000 project [ht |
Lidhje skedash
Këto faqe lidhen tek kjo skedë:
Përdorimi global i skedës
Kjo skedë përdoret nga Wiki të tjera në vijim:
- Përdorimi në ar.wikipedia.org
- Përdorimi në de.wikipedia.org
- Përdorimi në en.wikipedia.org
- Përdorimi në fa.wikipedia.org
- Përdorimi në fr.wikipedia.org
- Përdorimi në ga.wikipedia.org
- Përdorimi në gu.wikipedia.org
- Përdorimi në hi.wikipedia.org
- Përdorimi në hr.wikipedia.org
- Përdorimi në hu.wikipedia.org
- Përdorimi në ja.wikipedia.org
- Përdorimi në kn.wikipedia.org
- Përdorimi në nl.wikipedia.org
- Përdorimi në sh.wikipedia.org
- Përdorimi në sl.wikipedia.org
- Përdorimi në ta.wikipedia.org
- Përdorimi në th.wikipedia.org
- Përdorimi në vi.wikipedia.org
- Përdorimi në zh-min-nan.wikipedia.org
- Përdorimi në zh.wikipedia.org