Skeda:Newton iteration.png

Page contents not supported in other languages.
Nga Wikipedia, enciklopedia e lirë

Dokument origjinal((përmasa 2.406 × 1.978 px, madhësia skedës: 55 KB, lloji MIME: image/png))

Kjo skedë është prej Wikimedia Commons dhe mund të përdoret nga projekte të tjera. Përshkrimi në këtë skedë në këtë faqe nuk është treguar më poshtë. Shko tek faqja përshkruese në Commons Shko tek faqja përshkruese në Commons

Përmbledhje

File:Newton iteration.svg is a vector version of this file. It should be used in place of this PNG file when not inferior.

File:Newton iteration.png → File:Newton iteration.svg

For more information, see Help:SVG.
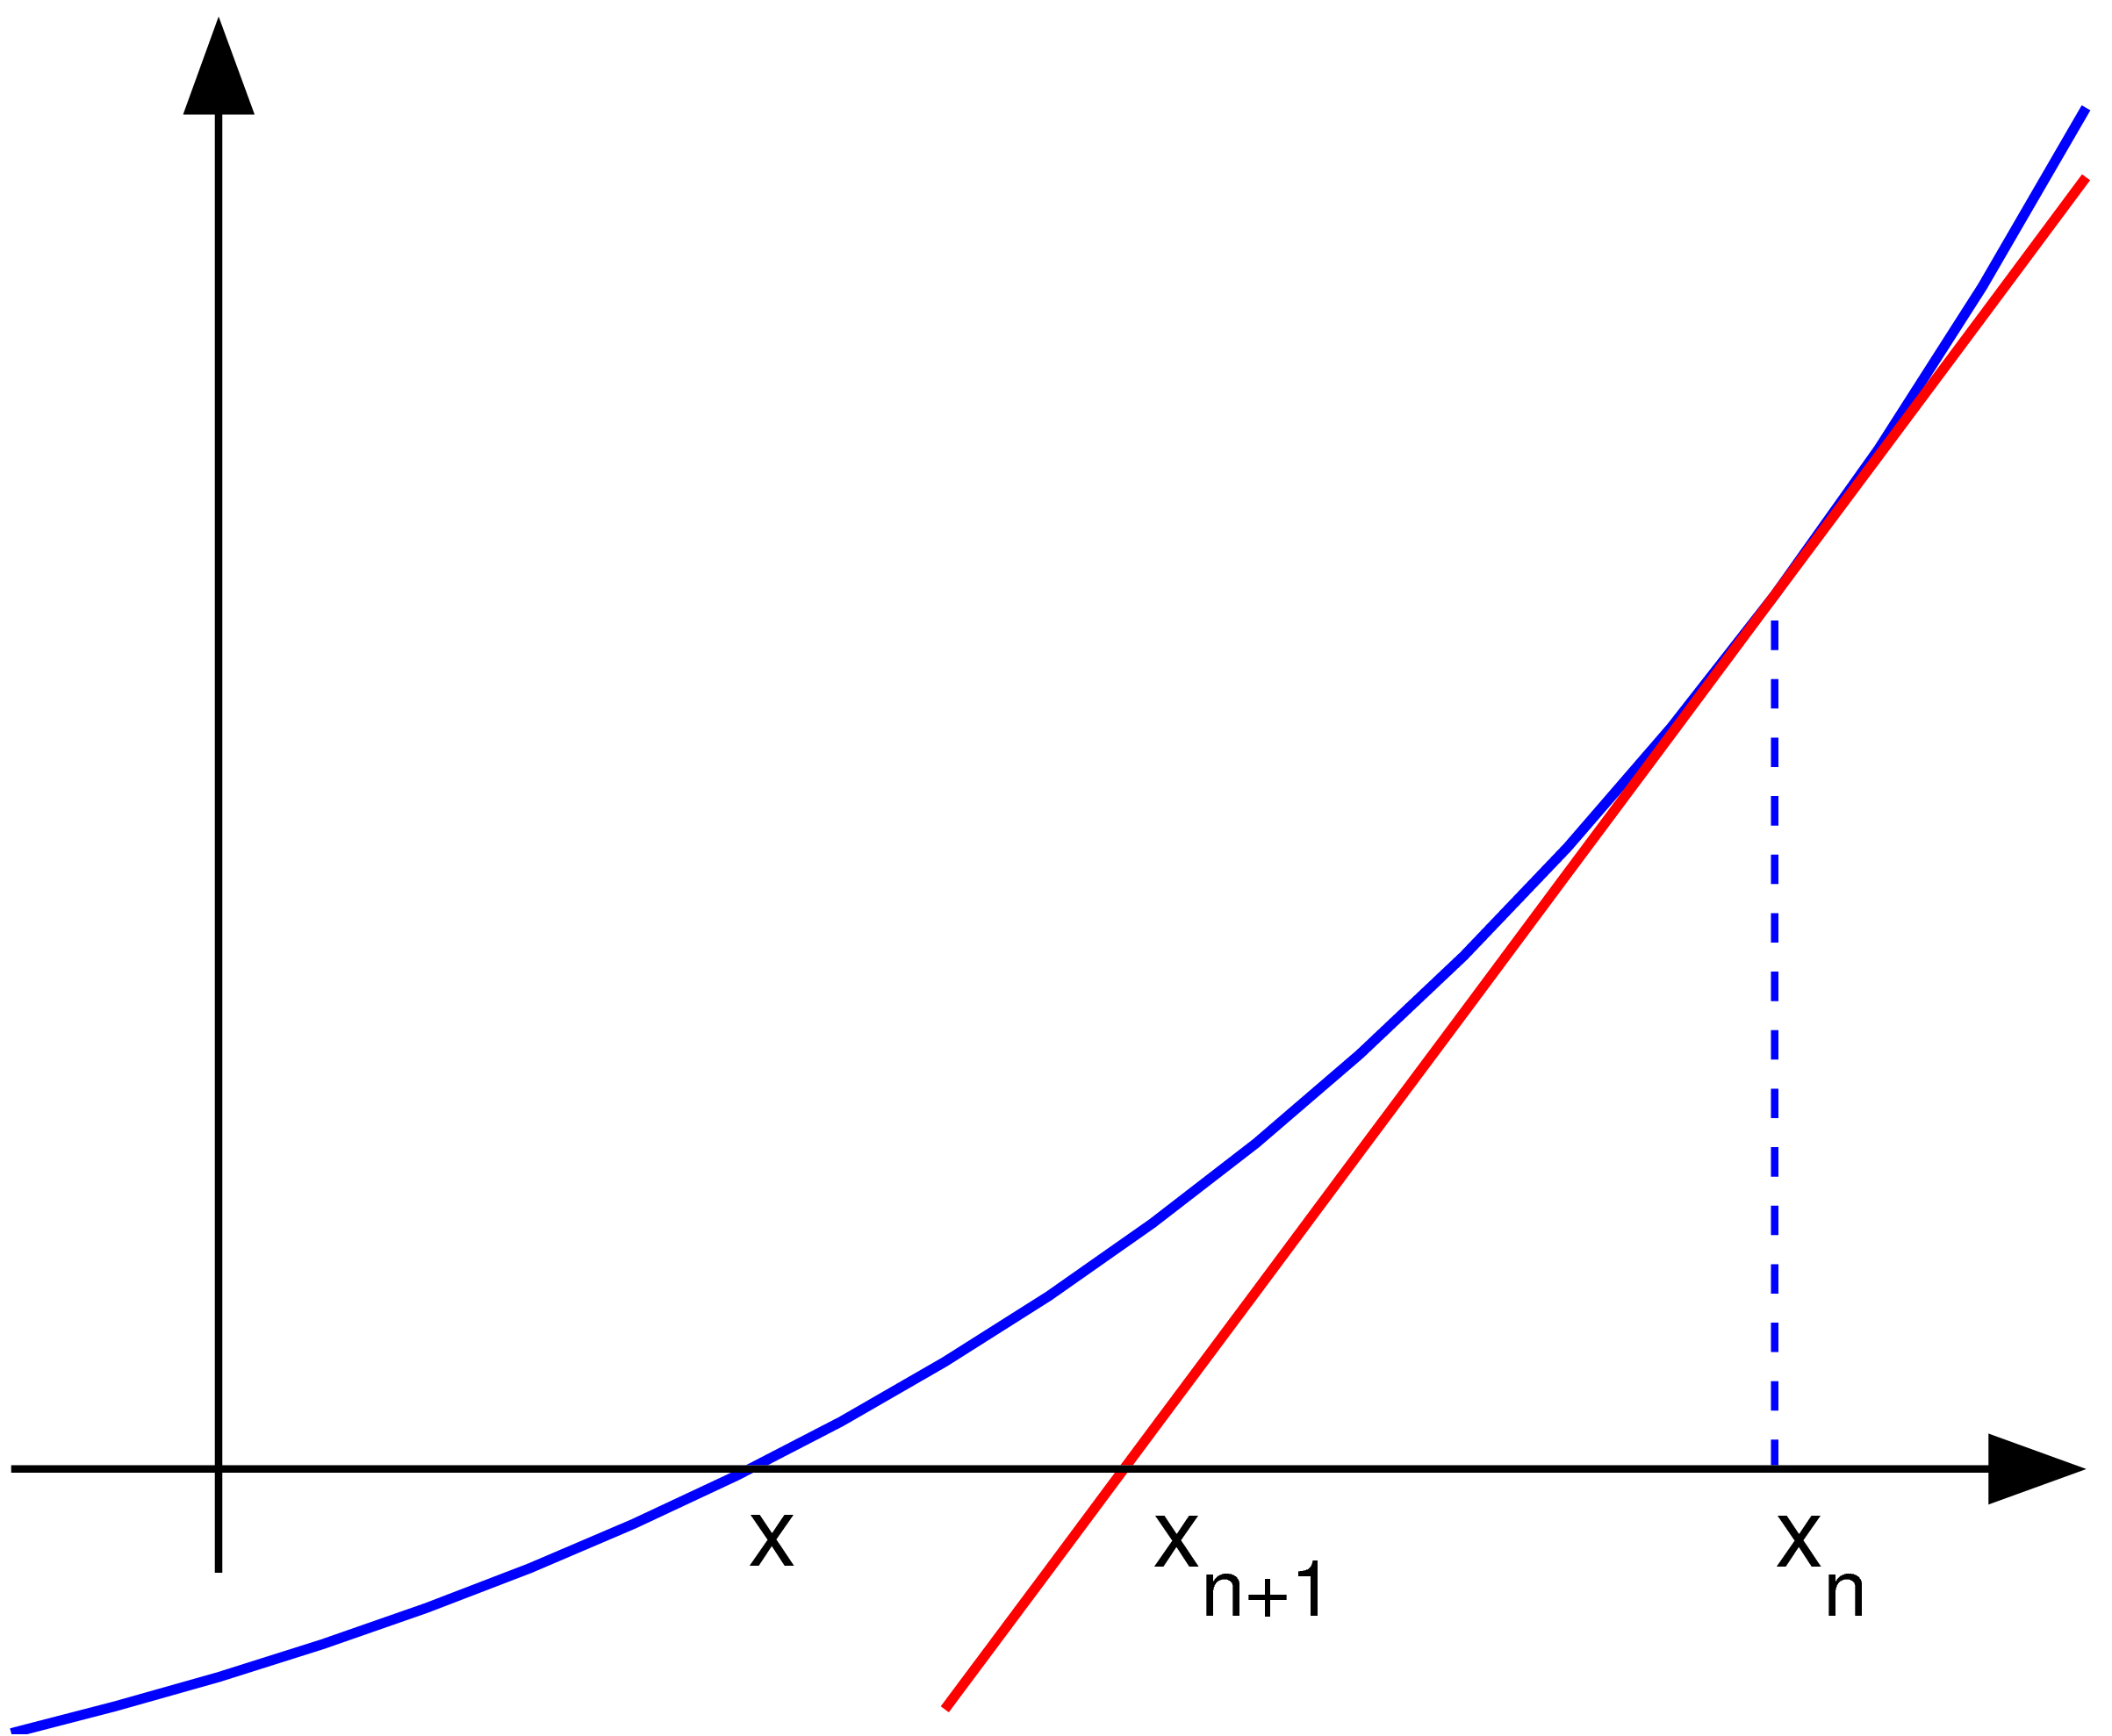
In other languages
Alemannisch  Bahasa Indonesia  Bahasa Melayu  British English  català  čeština  dansk  Deutsch  eesti  English  español  Esperanto  euskara  français  Frysk  galego  hrvatski  Ido  italiano  lietuvių  magyar  Nederlands  norsk bokmål  norsk nynorsk  occitan  Plattdüütsch  polski  português  português do Brasil  română  Scots  sicilianu  slovenčina  slovenščina  suomi  svenska  Tiếng Việt  Türkçe  vèneto  Ελληνικά  беларуская (тарашкевіца)  български  македонски  нохчийн  русский  српски / srpski  татарча/tatarça  українська  ქართული  հայերեն  বাংলা  தமிழ்  മലയാളം  ไทย  한국어  日本語  简体中文  繁體中文  עברית  العربية  فارسی  +/−
New SVG image

Përshkrimi Uploader graphed this with en:MATLAB (Illustration of en:Newton's method)
Data 22 nëntor 2004 (first version); 2004-11-23 (last version)
Burimi Transferred from en.wikipedia to Commons.
Autori Olegalexandrov at anglisht Wikipedia
PNG genesis
InfoField
Matlab Logo 
This diagram was created with MATLAB.
Kodi burimor
InfoField

MATLAB code

(Newton iteration)
% illustration of Newton's method for finding a zero of a function

function main ()
   
a=-1; b=1;   % interval endpoints
fs=20;       % text font size

% arrows settings
thickness1=2; thickness2=1.5; arrowsize=0.1; arrow_type=1;
angle=20; % in degrees

h=0.1;  % grid size
X=a:h:b; % points on the x axis
f=inline('exp(x)/1.5-0.5');   % function to plot
g=inline('exp(x)/1.5');       % derivative of f
x0=0.7; y0=f(x0);             % point at which to draw the tangent line 
m=g(x0);
Y=f(X);                       % points on the function to plot
XT=-0.1:h:b; YT=y0+(XT-x0)*m; % tangent line

% prepare the screen
clf; hold on; axis equal; axis off

% plot the graph and the tangent lines
plot(X, Y, 'linewidth', thickness1)
plot(XT, YT, 'r', 'linewidth', thickness1)
plot([x0 x0], [0, y0], '--', 'linewidth', thickness2)

% axes
small=0.2;
arrow([a 0], [b, 0], thickness2, arrowsize, angle, arrow_type, [0, 0, 0])
arrow([a+small, -0.1], [a+small, 1.4], thickness2, arrowsize, angle, arrow_type, [0, 0, 0])

% text
H=text(-0.29, -0.06,  'x'); set(H, 'fontsize', fs)
H=text(0.1, -0.1,  'x_{n+1}'); set(H, 'fontsize', fs)
H=text(0.7, -0.1,  'x_{n}'); set(H, 'fontsize', fs)

% save to disk
saveas(gcf, 'newton_iteration.eps', 'psc2')

function arrow(start, stop, thickness, arrow_size, sharpness, arrow_type, color)

% Function arguments:
% start, stop:  start and end coordinates of arrow, vectors of size 2
% thickness:    thickness of arrow stick
% arrow_size:   the size of the two sides of the angle in this picture ->
% sharpness:    angle between the arrow stick and arrow side, in degrees
% arrow_type:   1 for filled arrow, otherwise the arrow will be just two segments
% color:        arrow color, a vector of length three with values in [0, 1]

% convert to complex numbers
   i=sqrt(-1);
   start=start(1)+i*start(2); stop=stop(1)+i*stop(2);
   rotate_angle=exp(i*pi*sharpness/180);

% points making up the arrow tip (besides the "stop" point)
   point1 = stop - (arrow_size*rotate_angle)*(stop-start)/abs(stop-start);
   point2 = stop - (arrow_size/rotate_angle)*(stop-start)/abs(stop-start);

   if arrow_type==1 % filled arrow

      % plot the stick, but not till the end, looks bad
      t=0.5*arrow_size*cos(pi*sharpness/180)/abs(stop-start); stop1=t*start+(1-t)*stop;
      plot(real([start, stop1]), imag([start, stop1]), 'LineWidth', thickness, 'Color', color);

      % fill the arrow
      H=fill(real([stop, point1, point2]), imag([stop, point1, point2]), color);
      set(H, 'EdgeColor', 'none')

   else % two-segment arrow
      plot(real([start, stop]), imag([start, stop]),   'LineWidth', thickness, 'Color', color);
      plot(real([stop, point1]), imag([stop, point1]), 'LineWidth', thickness, 'Color', color);
      plot(real([stop, point2]), imag([stop, point2]), 'LineWidth', thickness, 'Color', color);
   end

Licencim

Public domain Kjo skedë është lëshuar në public domain nga autori i saj, Olegalexandrov at anglisht Wikipedia. Kjo aplikohet në të gjithë botën.
Në disa vende kjo mund të mos jetë e mundur ligjërisht; nëse është kështu:
Olegalexandrov i garanton çdokujt të drejtën për ta përdorur këtë punë për çdo qëllim, pa asnjë kusht, përveç rasteve kur këto kushte janë të kërkuara nga ligji.


Regjistri origjinal i ngarkimeve

The original description page was here. All following user names refer to en.wikipedia.
  • 2004-11-23 19:55 Olegalexandrov 405×340×8 (14290 bytes) Scaled down the picture of Newton's method
  • 2004-11-22 21:34 Olegalexandrov 509×406×8 (16510 bytes) I graphed this with Matlab (Illustration of Newton's method) {{PD}}

Captions

Add a one-line explanation of what this file represents

Items portrayed in this file

përshkruan

Historiku skedës

Shtypni mbi një datë/kohë për ta parë skedën siç ishte atëherë.

Data/KohaMiniaturëPërmasatPërdoruesiKoment
e tanishme25 maj 2007 05:23Miniaturë për versionin duke filluar nga 25 maj 2007 05:232.406 × 1.978 (55 KB)Oleg Alexandrov{{Information |Description=Uploader graphed this with en:MATLAB (Illustration of en:Newton's method) ==Source code== <pre> <nowiki> % illustration of Newton's method for finding a zero of a function function main () a=-1; b=1; % interva
13 qershor 2005 01:11Miniaturë për versionin duke filluar nga 13 qershor 2005 01:11405 × 340 (6 KB)Everlongoptimized for smaller file size
18 janar 2005 01:06Miniaturë për versionin duke filluar nga 18 janar 2005 01:06405 × 340 (14 KB)Andreas Ipp~commonswiki{{PD}}: Original author graphed this with MATLAB (Illustration of Newton's method), from Wikipedia.

S’ka faqe që përdorin këtë kartelë.

Përdorimi global i skedës

Kjo skedë përdoret nga Wiki të tjera në vijim: