
Skeda:Cauchy pdf.svg

Size of this PNG preview of this SVG file: 360 × 288 pixel. Rezolucione të tjera: 300 × 240 pixel | 600 × 480 pixel | 960 × 768 pixel | 1.280 × 1.024 pixel | 2.560 × 2.048 pixel.
Dokument origjinal (skedë SVG, fillimisht 360 × 288 pixel, madhësia e skedës: 36 KB)
| Kjo skedë është prej Wikimedia Commons dhe mund të përdoret nga projekte të tjera. Përshkrimi në këtë skedë në këtë faqe nuk është treguar më poshtë. | Shko tek faqja përshkruese në Commons |
Përmbledhje
| Përshkrimi |
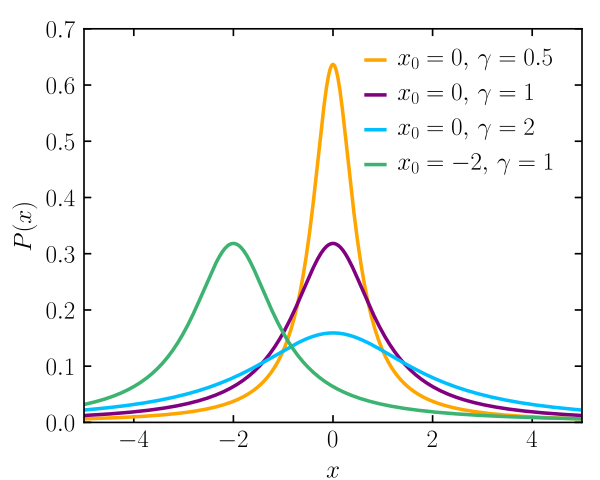
English: Plots of the density functions for several members of the Cauchy family of probability distributions. |
| Data | |
| Burimi | Punë e juaja |
| Autori | Skbkekas |
| SVG genesis | This plot was created with Matplotlib. |
| Kodi burimor | Python code#!/usr/bin/python
import numpy as np
import matplotlib.pyplot as plt
import scipy.special as sp
import matplotlib.font_manager
col = ['orange', 'purple', 'deepskyblue', 'mediumseagreen']
X = np.arange(-5, 5, 0.01)
##
## PDF
##
plt.rc('text', usetex = True)
plt.rc('font', family = 'serif', size = 12)
plt.clf()
plt.figure(figsize=(4,3.2))
plt.axes([0.14,0.12,0.83,0.82])
# plt.hold(True)
X = np.arange(-5, 5, 0.01)
A = []
for k,(x,g) in enumerate([(0,0.5),(0,1),(0,2),(-2,1)]):
Y = ((X-x)/g)**2 + 1
Y = 1/(np.pi*g*Y)
a = plt.plot(X, Y, '-', color=col[k], lw=1.7)
A.append(a)
plt.xlabel("$x$")
plt.ylabel("$P(x)$")
plt.ylim([0,0.7])
plt.tick_params(direction='in', top=True, right=True)
prop = matplotlib.font_manager.FontProperties(size=12)
# bx =
plt.legend(("$x_0=0,\\, \\gamma=0.5$", "$x_0=0,\\,\\gamma=1$",\
"$x_0=0,\\, \\gamma=2$", "$x_0=-2,\\, \\gamma=1$"),
numpoints=1, handlelength=0.75, handletextpad=0.5,\
loc="upper right", frameon=False)
# bx.draw_frame(False)
plt.xlim(-5,5)
plt.savefig("cauchy_pdf.pdf")
plt.savefig("cauchy_pdf.svg")
|
Licencim
Unë, krijuesi i kësaj pune, e publikoj këtu në bazë të licensës në vijim:
Kjo skedë është dhënë për përdorim sipas licensës Creative Commons Attribution 3.0 Unported.
- Je i lirë të:
- ta shpërndani – ta kopjoni, rishpërndani dhe përcillni punën
- t’i bëni “remix” – të përshtatni punën
- Sipas kushteve të mëposhtme:
- atribuim – Duhet t’i jepni meritat e duhura, të siguroni një lidhje për tek licenca dhe të tregoni nëse janë bërë ndryshime. Këtë mund ta bëni në ndonjë mënyrë të arsyeshme, por jo në ndonjë mënyrë që sugjeron se licencuesi ju del zot juve apo përdorimit tuaj.
Historiku skedës
Shtypni mbi një datë/kohë për ta parë skedën siç ishte atëherë.
| Data/Koha | Miniaturë | Përmasat | Përdoruesi | Koment | |
|---|---|---|---|---|---|
| e tanishme | 21 nëntor 2020 04:25 | | 360 × 288 (36 KB) | AkanoToE | Made all text LaTeX, spacing in legend more aesthetic. |
| 4 mars 2010 17:23 |  | 360 × 288 (39 KB) | Skbkekas | {{Information |Description={{en|1=Plots of the density functions for several members of the Cauchy family of probability distributions.}} |Source={{own}} |Author=Skbkekas |Date=2010-03-02 |Permission= |other_versions= }} [[Category:Stat |
Lidhje skedash
Këto faqe lidhen tek kjo skedë:
Përdorimi global i skedës
Kjo skedë përdoret nga Wiki të tjera në vijim:
- Përdorimi në ar.wikipedia.org
- Përdorimi në be.wikipedia.org
- Përdorimi në ca.wikipedia.org
- Përdorimi në de.wikipedia.org
- Përdorimi në de.wikiversity.org
- Përdorimi në en.wikipedia.org
- Përdorimi në en.wikiquote.org
- Përdorimi në en.wiktionary.org
- Përdorimi në es.wikipedia.org
- Përdorimi në fa.wikipedia.org
- Përdorimi në fi.wikipedia.org
- Përdorimi në fr.wikipedia.org
- Përdorimi në hi.wikipedia.org
- Përdorimi në it.wikipedia.org
- Përdorimi në ko.wikipedia.org
- Përdorimi në oc.wikipedia.org
- Përdorimi në pt.wikipedia.org
- Përdorimi në sl.wikipedia.org
- Përdorimi në tr.wikipedia.org
- Përdorimi në uk.wikipedia.org
- Përdorimi në www.wikidata.org