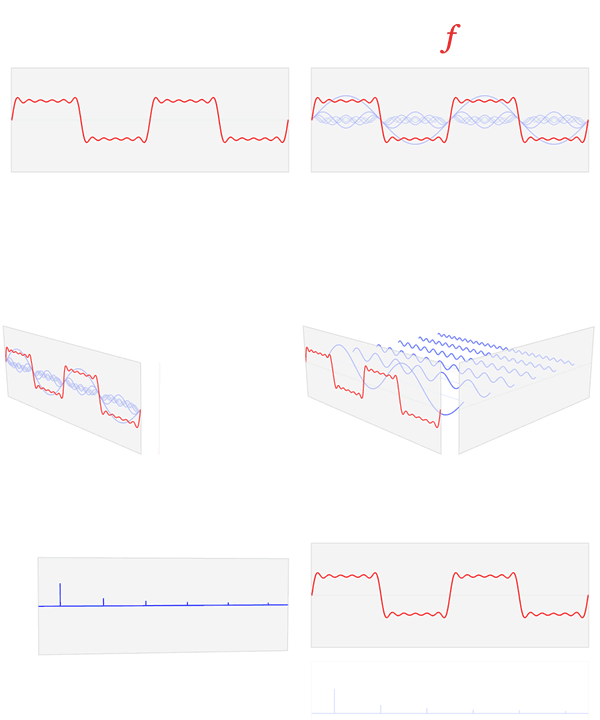
Skeda:Fourier transform time and frequency domains (small).gif
Fourier_transform_time_and_frequency_domains_(small).gif ((përmasa 300 × 240 px, madhësia skedës: 265 KB, lloji MIME: image/gif), kthyer, 93 korniza, 37 s)
Historiku skedës
Shtypni mbi një datë/kohë për ta parë skedën siç ishte atëherë.
| Data/Koha | Miniaturë | Përmasat | Përdoruesi | Koment | |
|---|---|---|---|---|---|
| e tanishme | 23 shkurt 2013 22:44 |  | 300 × 240 (265 KB) | LucasVB | {{Information |Description={{en|1=A visualization of the relationship between the time domain and the frequency domain of a function, based on its Fourier transform. The Fourier transform takes an input function f (in red) in the "time domain" and con... |
Lidhje skedash
Këto faqe lidhen tek kjo skedë:
Përdorimi global i skedës
Kjo skedë përdoret nga Wiki të tjera në vijim:
- Përdorimi në ar.wikipedia.org
- Përdorimi në ast.wikipedia.org
- Përdorimi në ca.wikipedia.org
- Përdorimi në de.wikipedia.org
- Përdorimi në el.wikipedia.org
- Përdorimi në en.wikipedia.org
- Përdorimi në en.wikibooks.org
- Përdorimi në es.wikipedia.org
- Përdorimi në es.wikibooks.org
- Përdorimi në et.wikipedia.org
- Përdorimi në fa.wikipedia.org
- Përdorimi në fa.wikibooks.org
- Përdorimi në he.wikipedia.org
- Përdorimi në ja.wikipedia.org
- Përdorimi në ko.wikipedia.org
- Përdorimi në www.mediawiki.org
- Përdorimi në mr.wikipedia.org
- Përdorimi në ms.wikipedia.org
- Përdorimi në nl.wikipedia.org
- Përdorimi në pt.wikipedia.org
- Përdorimi në pt.wikiversity.org
- Përdorimi në ru.wikipedia.org
- Përdorimi në simple.wikipedia.org
- Përdorimi në tt.wikipedia.org
- Përdorimi në uk.wikipedia.org
Shikoni më shumë përdorim global të kësaj skede.


