
Skeda:Runge phenomenon.svg

Size of this PNG preview of this SVG file: 600 × 600 pixel. Rezolucione të tjera: 240 × 240 pixel | 480 × 480 pixel | 768 × 768 pixel | 1.024 × 1.024 pixel | 2.048 × 2.048 pixel | 720 × 720 pixel.
Dokument origjinal (skedë SVG, fillimisht 720 × 720 pixel, madhësia e skedës: 24 KB)
| Kjo skedë është prej Wikimedia Commons dhe mund të përdoret nga projekte të tjera. Përshkrimi në këtë skedë në këtë faqe nuk është treguar më poshtë. | Shko tek faqja përshkruese në Commons |
Përmbledhje
| Përshkrimi |
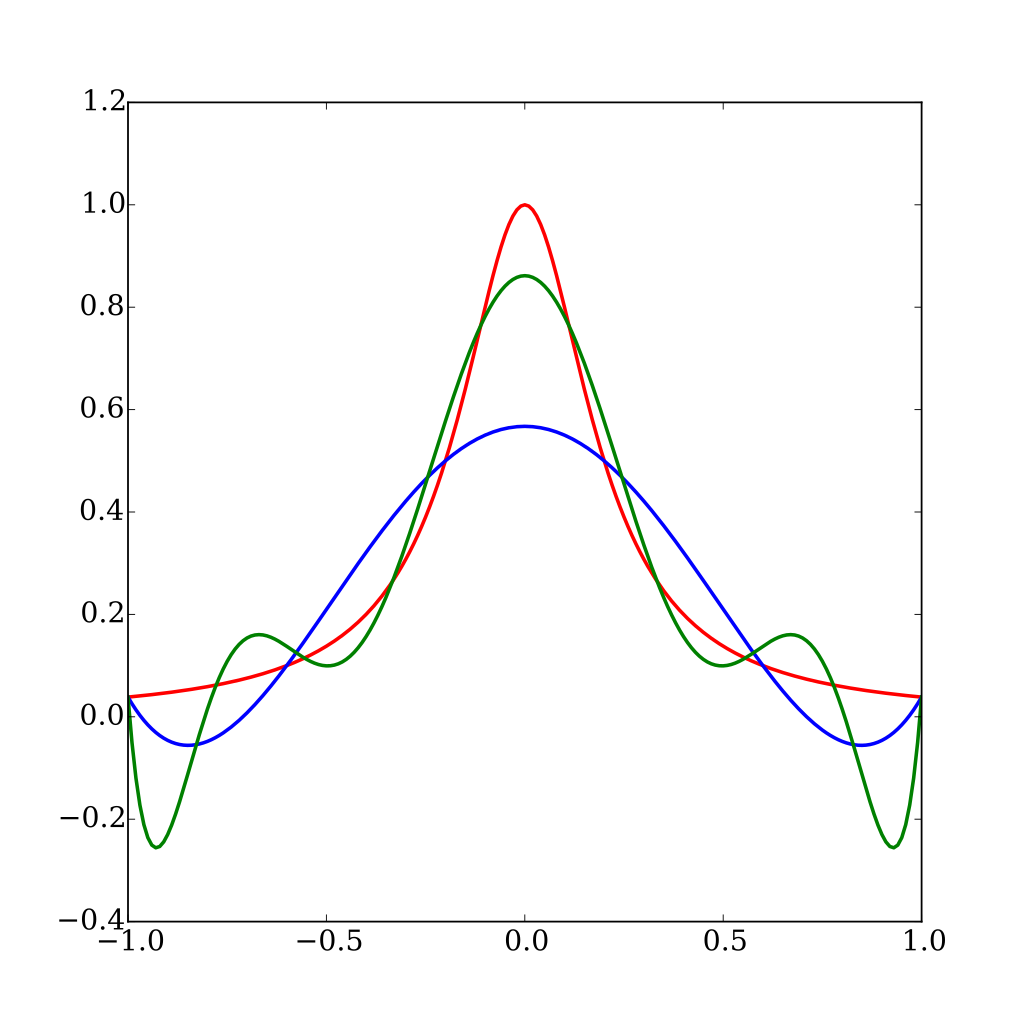
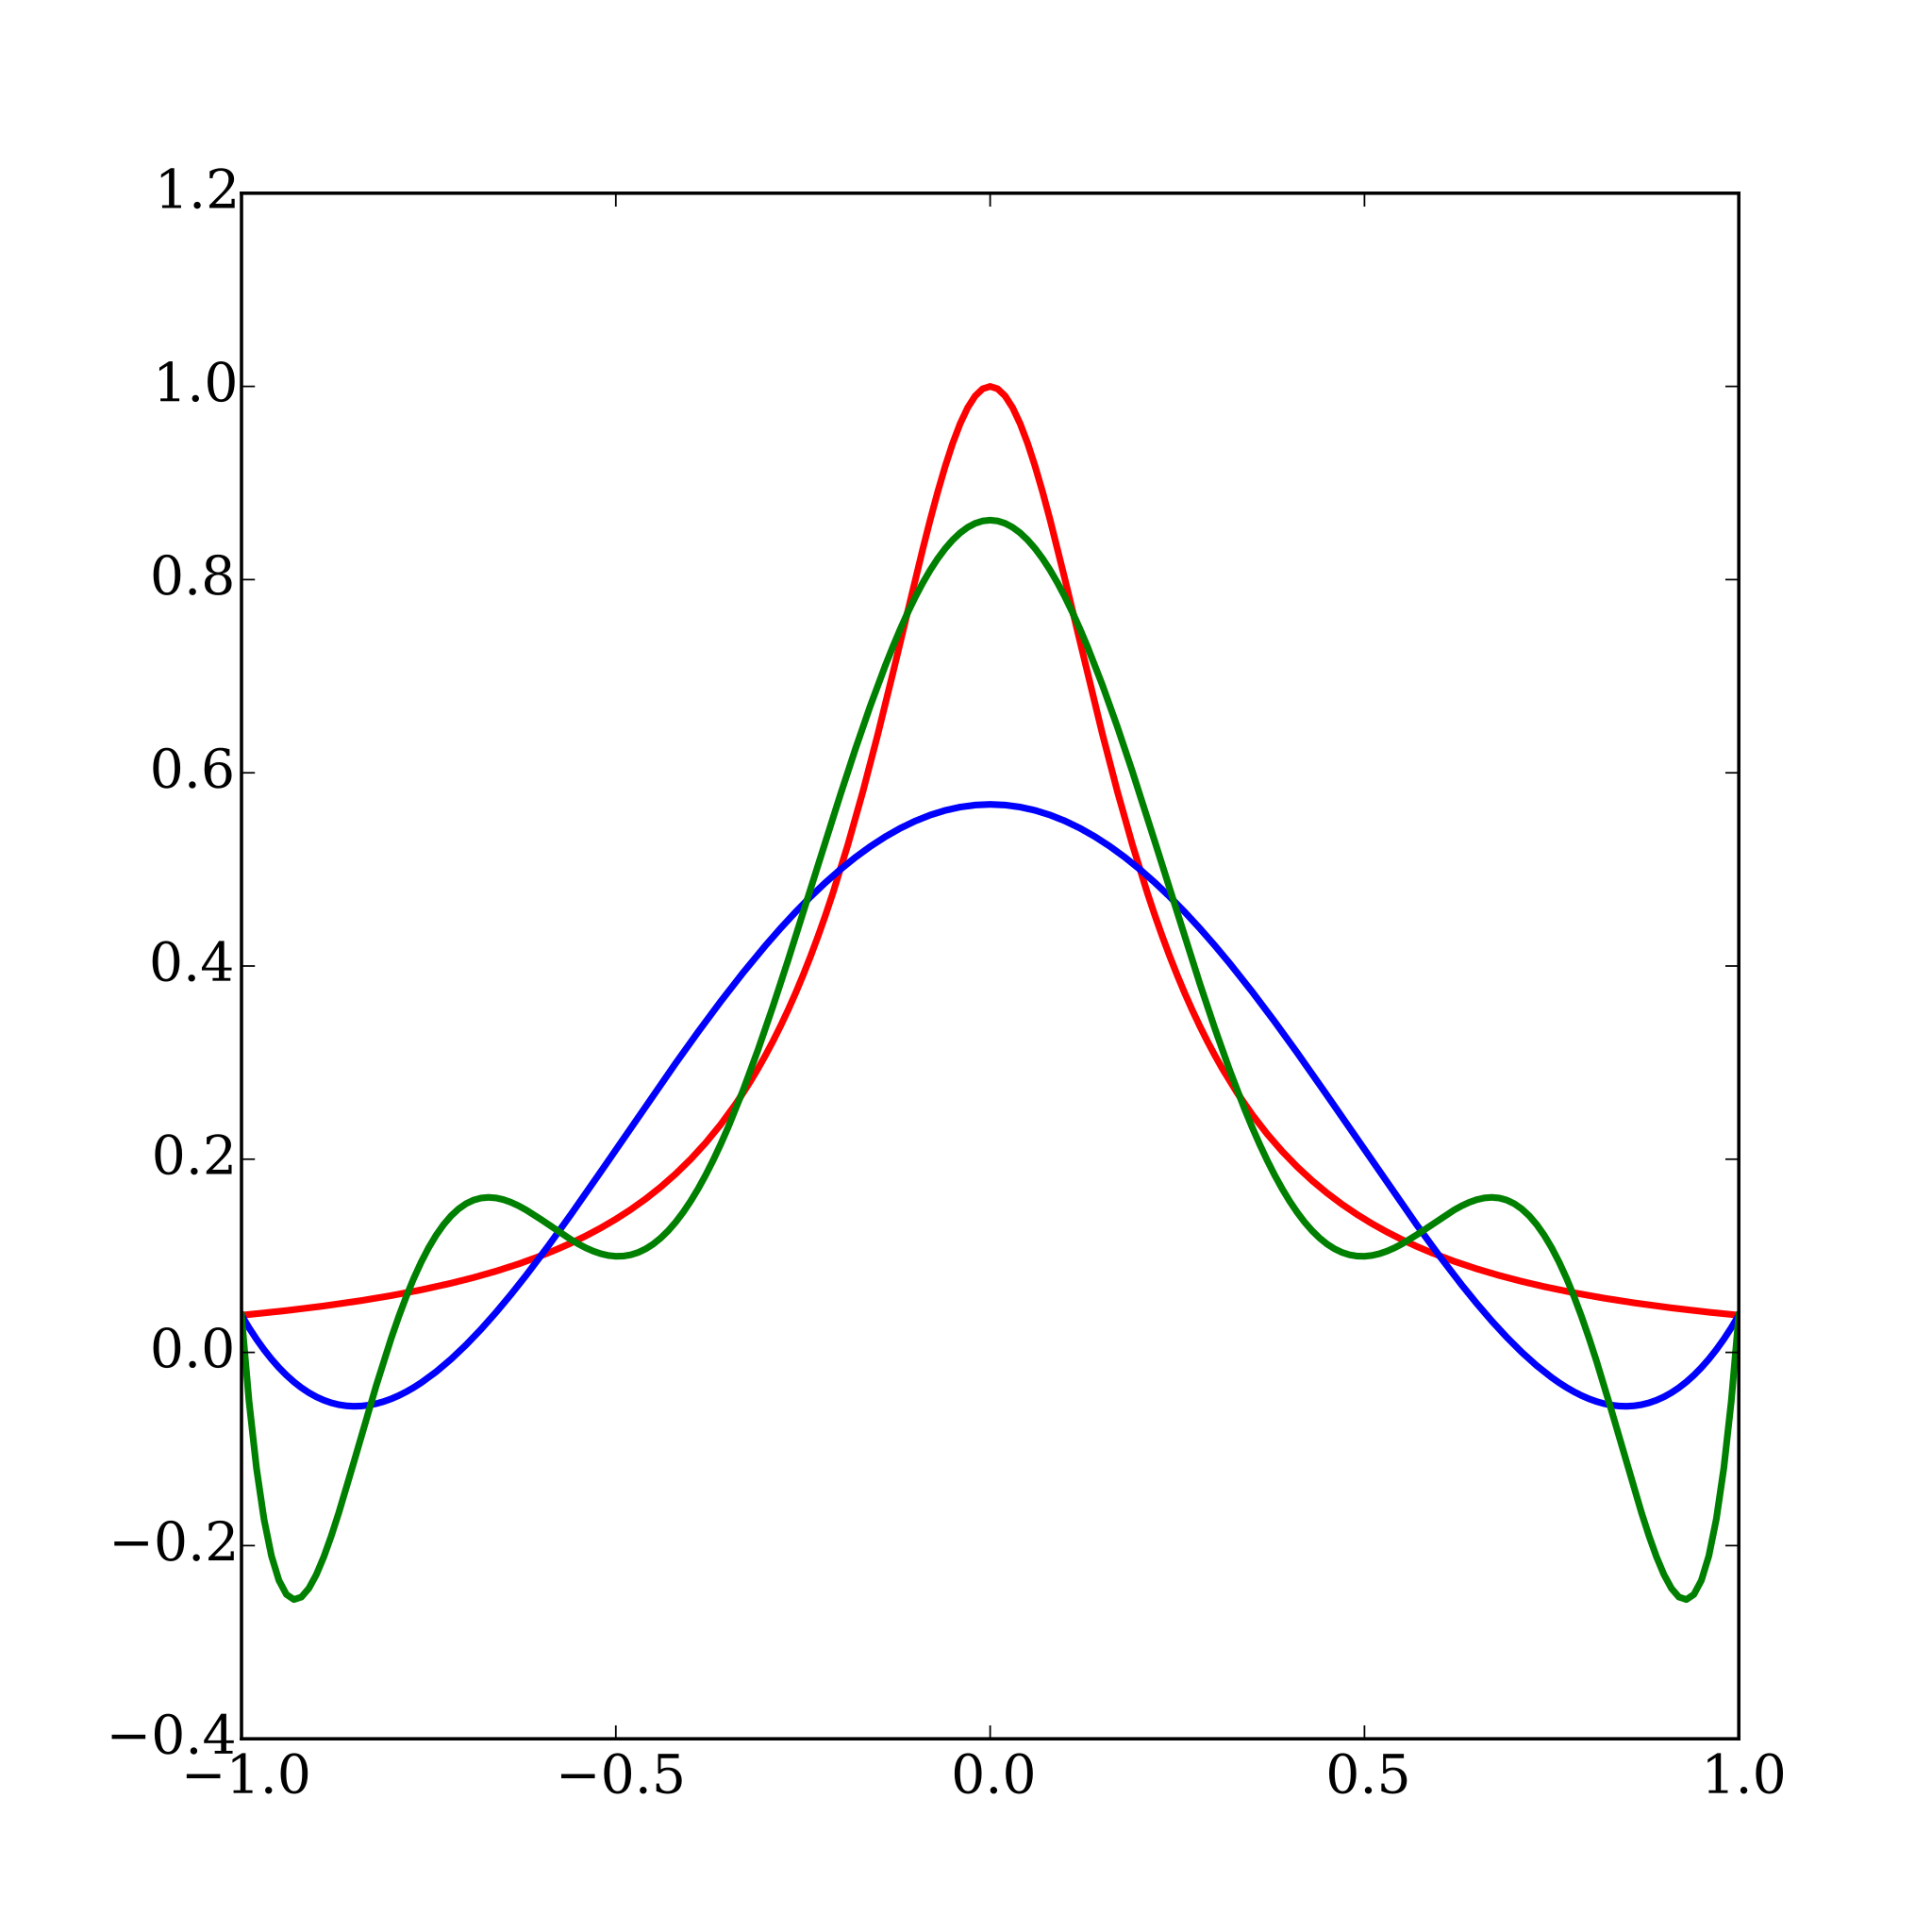
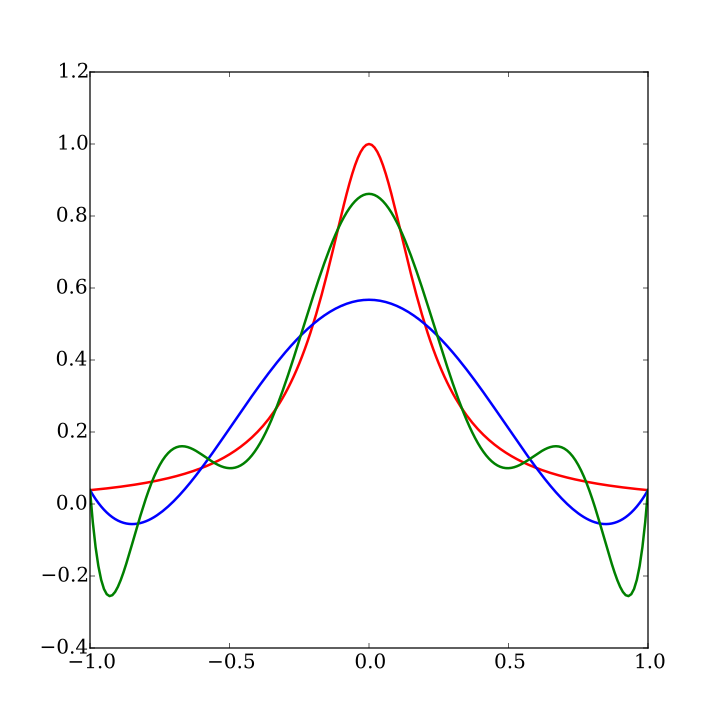
English: The red curve is the Runge function.
The blue curve is a 5th-order interpolating polynomial (using six equally spaced interpolating points). The green curve is a 9th-order interpolating polynomial (using ten equally spaced interpolating points). At the interpolating points, the error between the function and the interpolating polynomial is (by definition) zero. Between the interpolating points (especially in the region close to the endpoints 1 and −1), the error between the function and the interpolating polynomial gets worse for higher-order polynomials.Español: La curva roja es la función de Runge.
La curva azul es un polinomio interpolante de orden 5 (usando seis puntos equiespaciados). La curva verde es un polinomio interpolante de orden 9 (usando diez puntos equiespaciados). A los puntos interpolantes el error entre la función y el polinomio interpolantes es cero (por definición). Entre estos puntos (especialmente cerca de los extremos 1 y -1) el error entre la función y el polinomio interpolante incrementa conforme el polinomio aumenta de orden. |
| Data | |
| Burimi | Punë e juaja |
| Autori | Nicoguaro |
| SVG genesis | |
| Kodi burimor | Python codefrom __future__ import division
import numpy as np
import matplotlib.pyplot as plt
from scipy.interpolate import lagrange
from matplotlib import rcParams
rcParams['font.family'] = 'serif'
rcParams['font.size'] = 16
def runge(x):
return 1/(1 + 25*x**2)
plt.figure(figsize=(8,8))
npts = 201
# Runge Function
x_vec = np.linspace(-1, 1, npts)
y_vec = runge(x_vec)
plt.plot(x_vec, y_vec, lw=2, color='r')
# Fifth degree polynomial
pts_x = np.linspace(-1, 1, 6)
pts_y = runge(pts_x)
poly = lagrange(pts_x, pts_y)
y_interp = poly(x_vec)
plt.plot(x_vec, y_interp, lw=2, color='b')
# Ninth degree polynomial
pts_x = np.linspace(-1, 1, 10)
pts_y = runge(pts_x)
poly = lagrange(pts_x, pts_y)
y_interp = poly(x_vec)
plt.plot(x_vec, y_interp, lw=2, color='g')
plt.savefig("Runge_phenomenon.svg")
plt.show()
|
Licencim
Unë, krijuesi i kësaj pune, e publikoj këtu në bazë të licensës në vijim:
This file is licensed under the Creative Commons Attribution 4.0 International license.
- Je i lirë të:
- ta shpërndani – ta kopjoni, rishpërndani dhe përcillni punën
- t’i bëni “remix” – të përshtatni punën
- Sipas kushteve të mëposhtme:
- atribuim – Duhet t’i jepni meritat e duhura, të siguroni një lidhje për tek licenca dhe të tregoni nëse janë bërë ndryshime. Këtë mund ta bëni në ndonjë mënyrë të arsyeshme, por jo në ndonjë mënyrë që sugjeron se licencuesi ju del zot juve apo përdorimit tuaj.
Historiku skedës
Shtypni mbi një datë/kohë për ta parë skedën siç ishte atëherë.
| Data/Koha | Miniaturë | Përmasat | Përdoruesi | Koment | |
|---|---|---|---|---|---|
| e tanishme | 23 tetor 2015 01:40 | | 720 × 720 (24 KB) | Nicoguaro | User created page with UploadWizard |
Lidhje skedash
Këto faqe lidhen tek kjo skedë:
Përdorimi global i skedës
Kjo skedë përdoret nga Wiki të tjera në vijim:
- Përdorimi në cs.wikipedia.org
- Përdorimi në en.wikipedia.org
- Përdorimi në es.wikipedia.org
- Përdorimi në ja.wikipedia.org