
Rajonet e Anglisë: Dallime mes rishikimesh
| [Redaktim i kontrolluar] | [Redaktim i kontrolluar] |
Content deleted Content added
Etiketat: Redaktim nga celulari Redaktim në versionin web nga celulari |
Etiketat: Redaktim nga celulari Redaktim në versionin web nga celulari |
||
| Rreshti 74: | Rreshti 74: | ||
{{Stampa:England Labelled Map}} |
{{Stampa:England Labelled Map}} |
||
{| class="wikitable sortable" style="text-align:right;" |
|||
|- |
|||
! scope = "row" style="text-align:center;" | Name<ref name=Regions>{{cite web|url=http://www.ons.gov.uk/ons/guide-method/geography/beginner-s-guide/administrative/england/government-office-regions/index.html |title=Regions (Former GORs) |publisher=ONS |date= |accessdate=2015-08-25}}</ref> |
|||
! Population |
|||
! 10-year % increase <br /> (to [[United Kingdom 2011 Census|2011 Census]]) |
|||
! Area |
|||
! Population<br />density |
|||
! Median gross annual<br/ >earnings (£) 2014<ref>{{cite web|title=ASHE 1997 to 2014 selected estimates (Excel sheet 408Kb)|url=http://www.ons.gov.uk/ons/rel/ashe/annual-survey-of-hours-and-earnings/2014-provisional-results/ashe-1997-to-2014-selected-estimates.xls|publisher=Office for National Statistics|accessdate=17 December 2014}}</ref> |
|||
!% of population claiming <br /> Income Support <br /> or JSA <br /> (August 2012) |
|||
!% as at August 2001 |
|||
!Largest urban area |
|||
|- |
|||
|align=center| [[South East England|South East]]<br /> |
|||
| 8,634,750 |
|||
| 7.9% |
|||
| {{cvt|19,095|km2|disp=br()|sortable=on}} |
|||
| {{cvt|452.20|/km2|disp=br()|sortable=on}} |
|||
| 28,629 |
|||
| 3.0% |
|||
| 5.4% |
|||
|align=center| [[Portsmouth]] |
|||
|- |
|||
|align=center| [[Greater London|London]] |
|||
| 8,173,941 |
|||
| 14.0% |
|||
| {{cvt|1,572|km2|disp=br()|sortable=on}} |
|||
| {{cvt|5199.71|/km2|disp=br()|sortable=on}} |
|||
| 35,069 |
|||
| 5.3% |
|||
| 10.1% |
|||
|align=center|[[London]] |
|||
|- |
|||
|align=center| [[North West England|North West]] |
|||
| 7,052,177 |
|||
| 4.8% |
|||
| {{cvt|14,165|km2|disp=br()|sortable=on}} |
|||
| {{cvt|497.86|/km2|disp=br()|sortable=on}} |
|||
| 25,229 |
|||
| 5.3% |
|||
| 10.4% |
|||
|align=center| [[Manchester]] |
|||
|- |
|||
|align=center| [[East of England]] |
|||
| 5,846,965 |
|||
| 8.5% |
|||
| {{cvt|19,120|km2|disp=br()|sortable=on}} |
|||
| {{cvt|305.80|/km2|disp=br()|sortable=on}} |
|||
| 26,830 |
|||
| 3.5% |
|||
| 6.2% |
|||
|align=center| [[Norwich]] |
|||
|- |
|||
|align=center| [[West Midlands (region)|West Midlands]] |
|||
| 5,601,847 |
|||
| 6.4% |
|||
| {{cvt|13,000|km2|disp=br()|sortable=on}} |
|||
| {{cvt|430.00|/km2|disp=br()|sortable=on}} |
|||
| 24,920 |
|||
| 5.1% |
|||
| 9.2% |
|||
|align=center| [[Birmingham]] |
|||
|- |
|||
|align=center| [[South West England|South West]] |
|||
| 5,288,935 |
|||
| 7.3% |
|||
| {{cvt|23,829|km2|disp=br()|sortable=on}} |
|||
| {{cvt|221.95|/km2|disp=br()|sortable=on}} |
|||
| 25,571 |
|||
| 3.3% |
|||
| 6.8% |
|||
|align=center| [[Bristol]] |
|||
|- |
|||
|align=center| {{nowrap|[[Yorkshire and the Humber]]}} |
|||
| 5,283,733 |
|||
| 6.4% |
|||
| {{cvt|15,420|km2|disp=br()|sortable=on}} |
|||
| {{cvt|342.65|/km2|disp=br()|sortable=on}} |
|||
| 24,999 |
|||
| 5.2% |
|||
| 9.3% |
|||
|align=center| [[Leeds]] |
|||
|- |
|||
|align=center| [[East Midlands]] |
|||
| 4,533,222 |
|||
| 8.7% |
|||
| {{cvt|15,627|km2|disp=br()|sortable=on}} |
|||
| {{cvt|290.09|/km2|disp=br()|sortable=on}} |
|||
| 25,027 |
|||
| 4.2% |
|||
| 7.7% |
|||
|align=center| [[Leicester]] |
|||
|- |
|||
|align=center| [[North East England|North East]] |
|||
| 2,596,886 |
|||
| 3.2% |
|||
| {{cvt|8,592|km2|disp=br()|sortable=on}} |
|||
| {{cvt|302.24|/km2|disp=br()|sortable=on}} |
|||
| 24,876 |
|||
| 6.1% |
|||
| 11.6% |
|||
|align=center| [[Newcastle upon Tyne]] |
|||
|- |
|||
! England |
|||
! 53,012,456 |
|||
! 7.88% |
|||
! {{cvt|130,420|km2|disp=br()|sortable=on}} |
|||
! {{cvt|406.55|/km2|disp=br()|sortable=on}} |
|||
! 27,487 |
|||
! 4.45% |
|||
! 8.32%<ref name=ons>[http://neighbourhood.statistics.gov.uk/ Key Statistics: Population; Quick Statistics: Economic indicators]. ([[United Kingdom Census 2011|2011 census]] and [[United Kingdom Census 2001|2001 census]]) Retrieved 2015-02-27.{{dead link|date=February 2017}}</ref> |
|||
! [[London]] |
|||
|} |
|||
Versioni i datës 8 shtator 2019 21:48
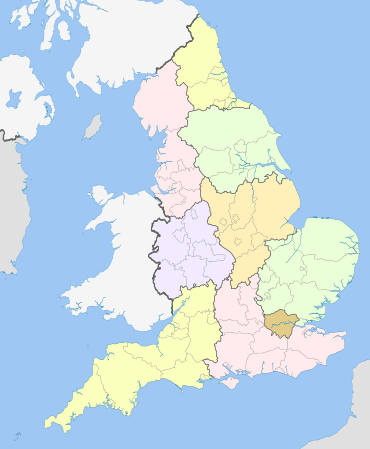
Rajonet, të njohura më parë si Rajonet e Zyrës së Qeverisë, janë niveli më i lartë i ndarjes administrative në Angli. Midis 1994 dhe 2011, nëntë rajone kishin zëvendësuar zyrtarisht funksionet brenda qeverisë. Ndërsa ata nuk e përmbushin më këtë rol, vazhdojnë të përdoren për qëllime statistikore dhe për disa qëllime administrative. Ata përcaktojnë votimet (zonat elektorale) për qëllime të zgjedhjeve në Parlamentin Evropian. Eurostat gjithashtu i përdor ato për të demarkuar Nomenklaturën e Njësive Territoriale për Statistikat (NUTS) rajone ("NUTS 1 rajone") brenda Bashkimit Evropian. Rajonet zakonisht ndjekin kufijtë e rajoneve të mëparshme standarde, të vendosura në vitet 1940 për qëllime statistikore.
| Rajonet e Anglisë Regions of England (anglisht) | |
|---|---|
| Kategoria | Rajone statistikore Rajone administrative |
| Vendi | Angli |
| Krijuar | 1994 |
| Numri | 9 |
| Popullsia | 2,596,886–8,634,750 |
| Sipërfaqja | 1,572–23,829 km² |
| Nënndarjet | Qarqet metropolitane Qarqet jo-metropolitane Rrethet |
Rajonet
| Name[1] | Population | 10-year % increase (to 2011 Census) |
Area | Population density |
Median gross annual earnings (£) 2014[2] |
% of population claiming Income Support or JSA (August 2012) |
% as at August 2001 | Largest urban area |
|---|---|---|---|---|---|---|---|---|
| South East |
8,634,750 | 7.9% | 19,095 km2 (7,373 sq mi) |
452.20/km2 (1,171.2/sq mi) |
28,629 | 3.0% | 5.4% | Portsmouth |
| London | 8,173,941 | 14.0% | 1,572 km2 (607 sq mi) |
5,199.71/km2 (13,467.2/sq mi) |
35,069 | 5.3% | 10.1% | London |
| North West | 7,052,177 | 4.8% | 14,165 km2 (5,469 sq mi) |
497.86/km2 (1,289.5/sq mi) |
25,229 | 5.3% | 10.4% | Manchester |
| East of England | 5,846,965 | 8.5% | 19,120 km2 (7,380 sq mi) |
305.80/km2 (792.0/sq mi) |
26,830 | 3.5% | 6.2% | Norwich |
| West Midlands | 5,601,847 | 6.4% | 13,000 km2 (5,000 sq mi) |
430.00/km2 (1,113.7/sq mi) |
24,920 | 5.1% | 9.2% | Birmingham |
| South West | 5,288,935 | 7.3% | 23,829 km2 (9,200 sq mi) |
221.95/km2 (574.8/sq mi) |
25,571 | 3.3% | 6.8% | Bristol |
| Yorkshire and the Humber | 5,283,733 | 6.4% | 15,420 km2 (5,950 sq mi) |
342.65/km2 (887.5/sq mi) |
24,999 | 5.2% | 9.3% | Leeds |
| East Midlands | 4,533,222 | 8.7% | 15,627 km2 (6,034 sq mi) |
290.09/km2 (751.3/sq mi) |
25,027 | 4.2% | 7.7% | Leicester |
| North East | 2,596,886 | 3.2% | 8,592 km2 (3,317 sq mi) |
302.24/km2 (782.8/sq mi) |
24,876 | 6.1% | 11.6% | Newcastle upon Tyne |
| England | 53,012,456 | 7.88% | 130,420 km2 (50,360 sq mi) |
406.55/km2 (1,053.0/sq mi) |
27,487 | 4.45% | 8.32%[3] | London |
- ^ "Regions (Former GORs)". ONS. Marrë më 2015-08-25.
{{cite web}}: Mungon ose është bosh parametri|language=(Ndihmë!) - ^ "ASHE 1997 to 2014 selected estimates (Excel sheet 408Kb)". Office for National Statistics. Marrë më 17 dhjetor 2014.
{{cite web}}: Mungon ose është bosh parametri|language=(Ndihmë!)Mirëmbajtja CS1: Datë e përkthyer automatikisht (lidhja) - ^ Key Statistics: Population; Quick Statistics: Economic indicators. (2011 census and 2001 census) Retrieved 2015-02-27.[lidhje e vdekur]